Create high-performance WebGL-powered data visualizations on Google Maps with deck.gl 967 words.
Last Updated
Have you ever tried to load thousands of datapoints into Google Maps? It probably didn’t go very well from a performance standpoint. Deck.gl is a library that solves this problem by running expensive computations on the GPU with WebGL. This means you can run realtime 3D visualizations on datasets with millions of geographic points.
In the following lesson, you will learn how to add high-performance data overlays to Google Maps based on a dataset of 140,000+ incidents of gun violence in the United States.
Initial Setup
You can use Deck.gl with any framework, but this demo uses vanilla JavaScript with Webpack.
Enable Google Maps
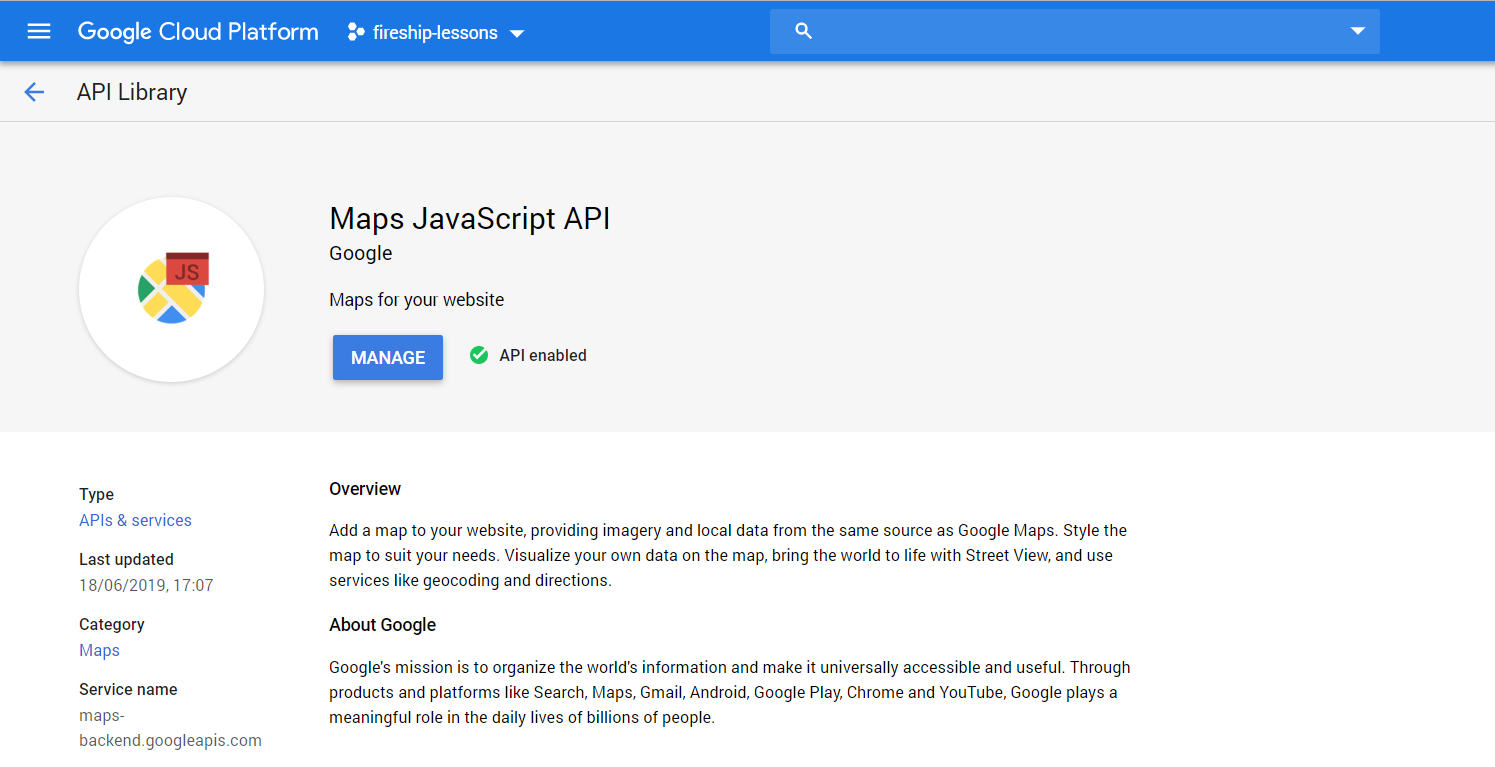
First, create a Google Cloud (or Firebase) project and obtain a browser API key for Google Maps JS.

Enable the Google Maps JavaScript API from a GCP project. Copy the browser API key from the credentials page.
Create a Webpack project
Start a new project from an empty directory.
npm init -y
npm i -D webpack-dev-server webpack webpack-cli
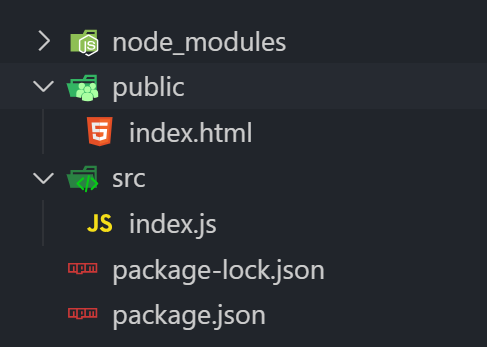
Create files for /public/index.html and /src/index.js.

Your project structure should look like this.
Now let’s add a script to the package.json file to build and serve the app locally.
  "scripts": {
    "build": "webpack --output-path ./public",
    "start": "webpack-dev-server --content-base ./public --output-path ./public --hot"
  },
Install Deck.gl
Deck.gl is a monorepo with layers separated into multiple packages. Install them with the following command:
npm i @deck.gl/{core,google-maps,layers,aggregation-layers}Initialize the Map
Create an HTML file that imports the webpack’d script and Google Maps. Add an empty div for the map.
<head>
    <script src="main.js"></script>

    <script defer src="https://maps.googleapis.com/maps/api/js?key=API-KEY&callback=initMap">
    </script>

    <style>
        body { margin: 0; }

        #map {
            width: 100vw;
            height: 100vh;
        }
    </style>
</head>
<body>

    <div id="map"></div>

</body>
When Google Maps is ready it will call the global initMap function.
window.initMap = () => {

    const map = new google.maps.Map(document.getElementById('map'), {
        center: {lat: 40.0, lng: -100.0},
        zoom: 5,
    });

}
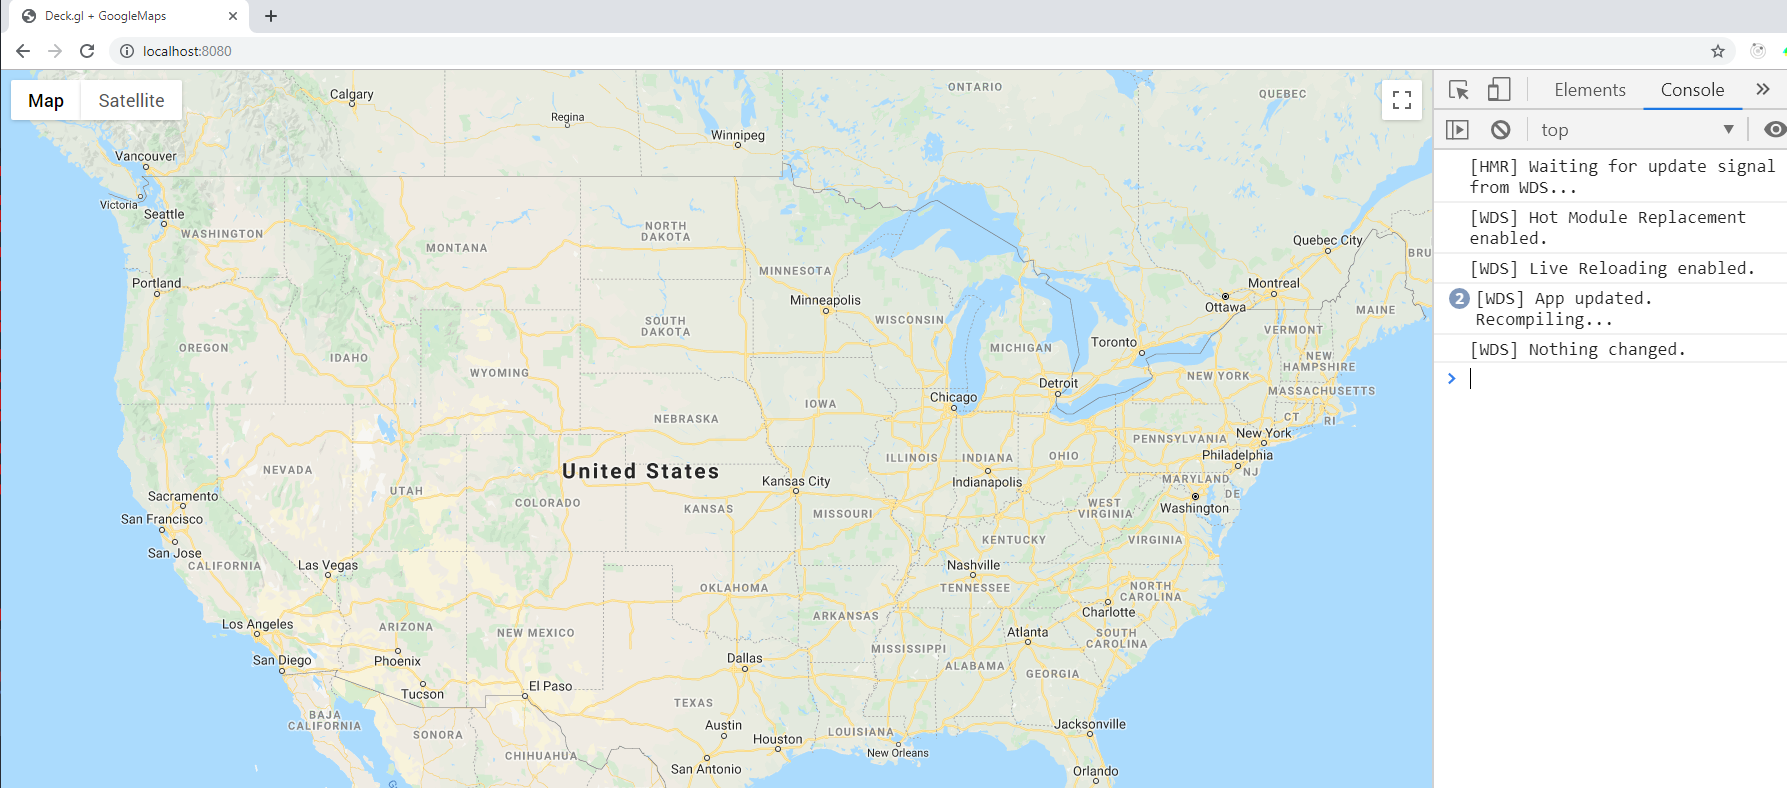
Run the start command and you should be up and running with hot module replacement on localhost:8080.
npm start
Google Maps with Webpack HMR
Get Data
The Easy way
Download the raw gun violence JSON data to public/gundata.json.
(Optional) The Developer Way… CSV to JSON
Deck.gl expects and JSON array of objects. The format of the object does not matter, but should at least have properties that represent latitude (y) and longitude (x). Most datasets are in CSV format - here’s a useful conversion script for Node.js if you’re working with your own custom data.
npm i -D convert-csv-to-jsonCreate a file called convert.js in the root of the project.
const csvToJson = require('convert-csv-to-json');

const input = './your-custom-data.csv';
const output = './public/gundata.json';

csvToJson.fieldDelimiter(',')
         .formatValueByType()
         .generateJsonFileFromCsv(input, output);
Run it:
node convert.jsAdd Deck.gl Data Layers
When you create a Deck.gl layer it takes a unique id that allows the library to efficiently make updates. Each layer provides a set of accessor properties like getPosition or getColor that call a function for each point in the dataset. In other words, it’s like looping over the entire dataset to determine each point’s position and color.
Scatterplot Layer
A scatterplot is one of the most basic data visualization layers. It adds a circle for every point in the dataset.

ScatterPlot layer with tooltips
import { GoogleMapsOverlay } from '@deck.gl/google-maps';
import { HexagonLayer } from '@deck.gl/aggregation-layers';
import { ScatterplotLayer } from '@deck.gl/layers';
import { HeatmapLayer } from '@deck.gl/aggregation-layers';


const sourceData = './gundata.json';

const scatterplot = () => new ScatterplotLayer({
    id: 'scatter',
    data: sourceData,
    opacity: 0.8,
    filled: true,
    radiusMinPixels: 2,
    radiusMaxPixels: 5,
    getPosition: d => [d.longitude, d.latitude],
    getFillColor: d => d.n_killed > 0 ? [200, 0, 40, 150] : [255, 140, 0, 100],
  });
Add Tooltips
Listen to events like onHover or onClick to update the UI in response to events.
const scatterplot = () => new ScatterplotLayer({
    // ... omitted

    pickable: true,
    onHover: ({object, x, y}) => {
        const el = document.getElementById('tooltip');
        if (object) {
          const { n_killed, incident_id } = object;
          el.innerHTML = `<h1>ID ${incident_id}</h1>`
          el.style.display = 'block';
          el.style.opacity = 0.9;
          el.style.left = x + 'px';
          el.style.top = y + 'px';
        } else {
          el.style.opacity = 0.0;
        }
    },

    onClick: ({object, x, y}) => {
      window.open(`https://www.gunviolencearchive.org/incident/${object.incident_id}`)
    },

  });
Include a tooltip div and CSS in the HTML file.
    <style/>
        #tooltip {
            position: absolute;
            background: white;
            margin: 10px; padding: 10px;
        }
    </style>
</head>
<body>

    <div id="map"></div>

    <div id="tooltip"></div>

</body>
Heatmap Layer
The heatmap layer will cluster points based on the map’s zoom level. As the user zooms out, it will aggregate the points into shapes/colors based on visible points in the view.

Heatmap Layer
Notice how getWeight is used to give incidents with more deaths and injuries a higher weight.
const heatmap = () => new HeatmapLayer({
      id: 'heat',
      data: sourceData,
      getPosition: d => [d.longitude, d.latitude],
      getWeight: d => d.n_killed + (d.n_injured * 0.5),
      radiusPixels: 60,
});
Hexagon Layer
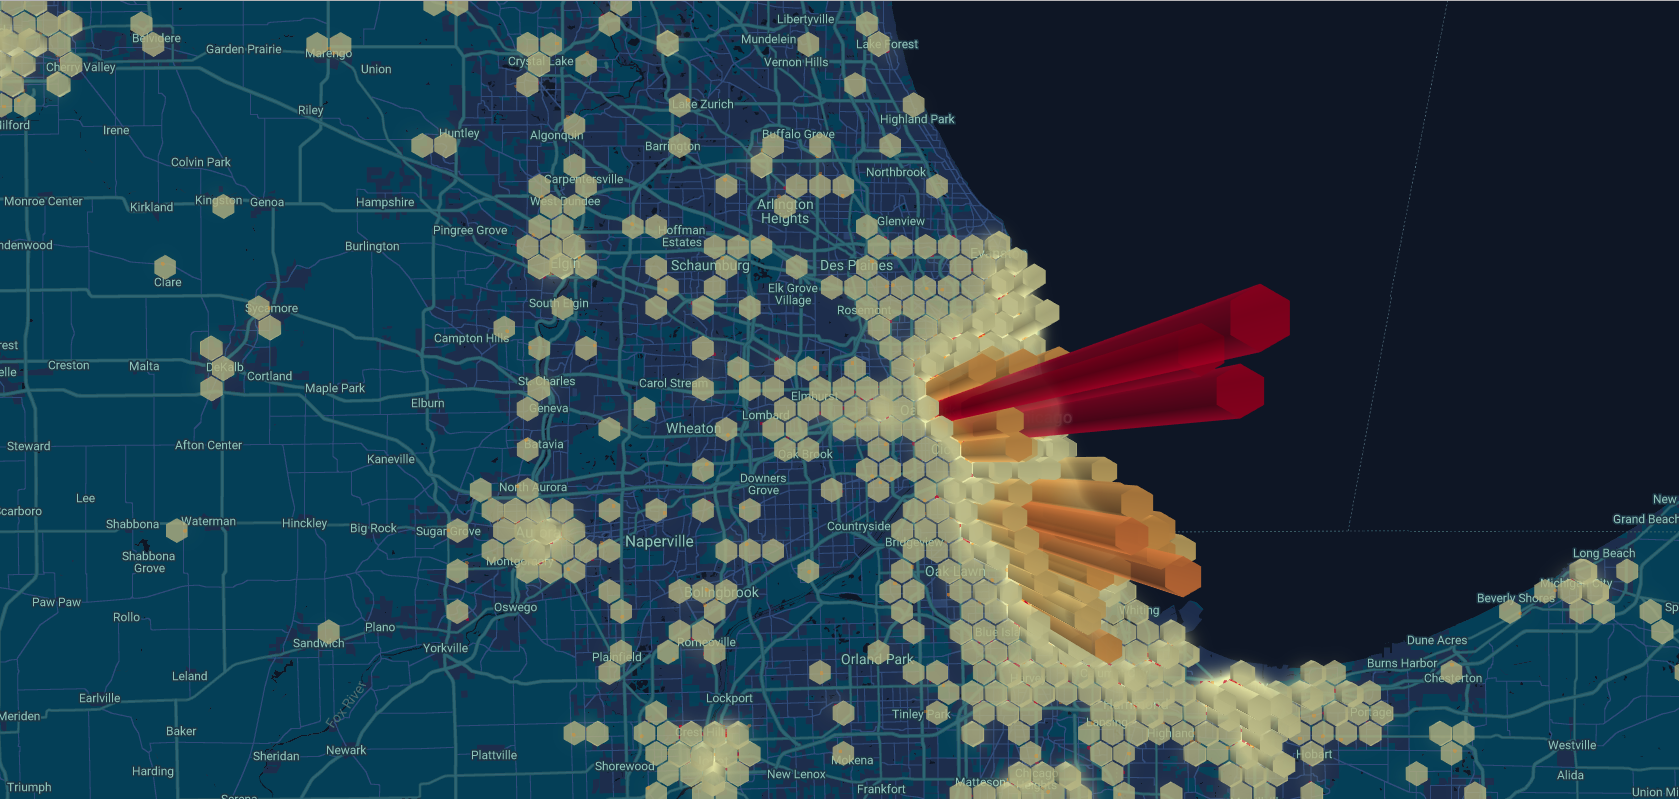
A hexagon layer aggregates points into a fixed radius. The elevation is then extruded on the z-axis based on the weight.

Hexagon Layer
A hexagon layer is similar to a heatmap, but the weight is extruded into a 3D shape.
const hexagon = () => new HexagonLayer({
        id: 'hex',
        data: sourceData,
        getPosition: d => [d.longitude, d.latitude],
        getElevationWeight: d => (d.n_killed * 2) + d.n_injured,
        elevationScale: 100,
        extruded: true,
        radius: 1609,
        opacity: 0.6,
        coverage: 0.88,
        lowerPercentile: 50
    });
Add Layers to the Map
The final step is add layers to the map. Deck.gl will composite the layers in a first-in-first-out patter, so the last element of the array sits on top. Update the initMap to create an overlay.
window.initMap = () => {

    const map = new google.maps.Map(document.getElementById('map'), {
        center: {lat: 40.0, lng: -100.0},
        zoom: 5,
    });

    const overlay = new GoogleMapsOverlay({
        layers: [
            scatterplot(),
            heatmap(),
            hexagon()
        ],
    });


    overlay.setMap(map);

}
